The spike in volatility
After a period of relative calm over 2012-2014 share market volatility has spiked over the last year as various worries about the global growth outlook intensified. With this renewed volatility a focus on risk in investing and a desire for safety has naturally come. But what is volatility? What drives it? Why does it come in cycles? Where are we now? And is it the same thing as risk?
What is volatility?
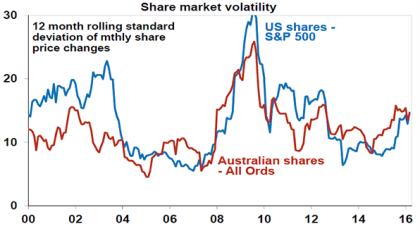
Volatility in investing refers to the degree to which an asset’s value fluctuates. The most common way to measure it is with a statistical concept called standard deviation which shows how tightly clustered past changes in the value of an asset or returns have been around their average in a certain period. The higher the standard deviation the greater the volatility. The standard deviation of monthly returns based on very long term data for major asset classes is around 0.5% for Australian cash, 3.5% for Australian government bonds, 12% for Australian real estate investment trusts, 16.5% for Australian shares and 15.5% for global shares. The following chart shows the standard deviation of monthly returns for Australian and US shares since 1990. As can be seen it has recently picked up.
Source: Thomson Reuters, AMP Capital
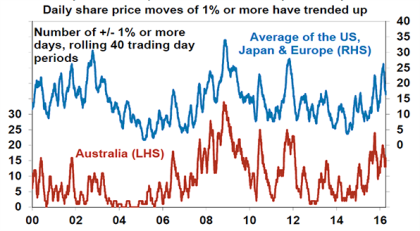
Another approach is to track the number of days when share markets move up or down by 1% or more. This is shown for shares over rolling 40 day trading periods in the next chart. Whereas this was running as low as 5 days in every 40 in 2014 earlier this year it had spiked to around 20 days in every 40.
Source: Bloomberg, AMP Capital
What drives volatility?
Investment market volatility is essentially determined by:
-
Uncertainty around market fundamentals – economic growth, earnings, dividends, interest rates etc. It often arises when there is a surprise development or change in direction.
-
Investor psychology or emotion – which pushes markets to extremes accentuating volatility.
In terms of the latter, the combination of lapses of logic (in particular the tendency of investors to extrapolate recent news and trends into the future) magnified by crowd psychology, where many investors end up thinking the same thing at the same time, can push markets to extremes resulting in volatility over and above that justified by fundamentals. Another way of thinking about this is that the share market is in large part influenced by stories that many investors buy into. Sometimes, eg through the tech boom of the late 1990s, these stories can be very positive and magnify uptrends. At other times like through the GFC or early this year these stories can be very negative and magnify negative trends.
Source: Thomson Reuters, AMP Capital
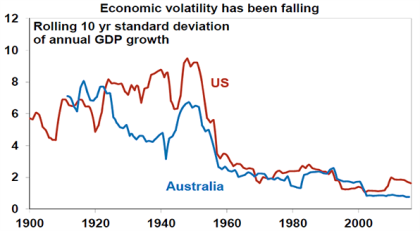
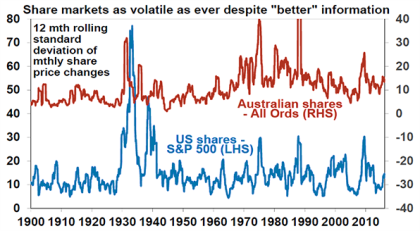
Over the last century or so fundamental drivers of volatility – like economic growth and inflation – have declined, as can be seen in the previous chart that shows the volatility of GDP growth. This decline in economic volatility has been driven by things like the growing role of the more stable services sector, better inventory control & macro management by central banks. This should have resulted in a decline in share market volatility, but the chart below shows that volatility in Australian and US shares is in the same range it’s been in over the last century.
Source: Thomson Reuters, AMP Capital
There may be a huge volume of more accessible information around investment markets today but if investors all get it at the same time from their screens (whether trading screens, TVs, smart phones, tablets etc) and end up having similar views and hence positions, then they are more likely to change their positions at the same time – resulting in additional volatility even though the fundamental drivers of volatility are less significant. The recency of the GFC and the Eurozone debt crisis has arguably driven investors from thinking extreme market falls happen every generation or so to occurring very 5 years or so and the desire to avoid getting burned again combined with an avalanche of information – often warning of imminent disasters – has resulted in a more short term focussed and twitchy investor base. So while fundamental drivers of volatility may have declined, investor sentiment or emotionally driven sources of volatility have arguably increased.
Volatility comes and goes – why the cycle?
So while investor psychology or emotional investing is arguably playing a bigger role in driving share market volatility, it’s also clear from the first two charts in this note that periods of volatility come and go. In a cyclical context:
-
Volatility tends to be quite low during the mid-cycle phase of the business cycle – ie when growth has picked up after a downturn but before the economy is too strong – as this is when the economy is most stable and arguably predictable, corporate debt is low, interest rates are moderate and shares are not at extreme valuations.
-
Volatility tends to rise during the boom, bust and then initial recovery phases in the business cycle. This tends to be when economic surprises – both good and bad – are at their greatest. It is also when share markets tend to become most misvalued and when investors take extreme positions.
So where are we now?
The relatively low level of share market volatility seen over the 2012-14 period is consistent with the global economy being in the relatively stable mid-cycle phase of the business cycle. Rounds of quantitative easing notably in in the US may have played a role in further suppressing volatility. It’s hard to put the recent volatility down to a move into the boom/bust phase of the cycle because there is little evidence to support it: global growth is far from booming, inflation is low, debt growth is low, shares are not overvalued, investors are not complacent and monetary policy is far from tight. These considerations suggest that we are not on our way to a re-run of the sort of volatility seen around the GFC. However, there are some reasons to expect volatility to remain higher than seen over the 2012-14 period: on some measures US shares are overvalued; corporate debt in the US has gone up; the Fed is still heading down a path of gradual rate hikes; the divergence between a tightening Fed and still easing other central banks is likely to create tensions in terms of currency shifts; the bust in commodity prices is likely to continue to impact; and with swings in investor sentiment continuing to play an outsized role.
Volatility is not the same as risk
So the bottom line is that we may have to get used to high levels of volatility for a while yet. But as my colleague Nader Naeimi has said “volatility is an unexpected deviation in the path to an investor’s destination (ie, the investment goal) which can lead to both risks and opportunities. Risk is the probability of not reaching the destination (ie, failing to achieve the goal)”. In other words there is much more to risk for investors than volatility. There are several points to note when thinking about volatility and the risk of not meeting your investment goals.
First, volatility often signals opportunity – high levels of investment market volatility often indicate opportunities for investors as it invariably surges during share market slumps like those seen into 2003 and 2009 as this is when shares are selling cheap. In fact, periods of low volatility when markets are smooth and investors relaxed can be periods of maximum risk.
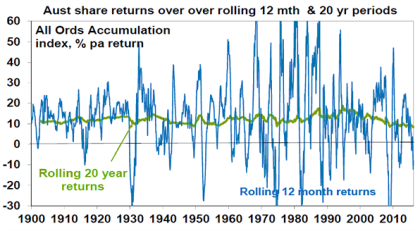
Second, time is on your side when it comes to investing – as it smooths out short term volatility. For example, while share market returns can be highly volatile over short term periods they tend to be quite smooth over long periods. Since 1900 for shares roughly two years out of ten have had negative returns but there are no negative returns over rolling 20 year periods.
Source: Global Financial Data, AMP Capital
Third, make sure that volatility does not compromise your ability to bounce back – leveraged strategies that involve the risk of being forced to close positions after falls are particularly risky during periods of volatility because you can be left without the ability to participate in the subsequent recovery in markets. So manage leveraged strategies carefully.
Fourth, think about what is most important – complete avoidance of any fall in the value of your investment or achieving a decent & stable income flow? If it’s the former then bank deposits are the way to go. If it’s the latter then there are a number of alternatives to consider including corporate debt, commercial property, infrastructure and shares offering decent, sustainable dividends.
Finally, turn down the noise – during volatile times in markets the negative news flow via traditional and social media can reach fever pitch and this is when we are most prone to making emotional decisions regarding our investments and joining the crowd. So the trick is to turn down the noise around investing.
During volatile times the key is to avoid the emotional investing driving the crowd, look for the opportunities that volatility provides and stick to a long term investment strategy.
Source: AMP Capital
About the Author
Dr Shane Oliver, Head of Investment Strategy and Economics and Chief Economist at AMP Capital is responsible for AMP Capital’s diversified investment funds. He also provides economic forecasts and analysis of key variables and issues affecting, or likely to affect, all asset markets.
Important note: While every care has been taken in the preparation of this article, AMP Capital Investors Limited (ABN 59 001 777 591, AFSL 232497) and AMP Capital Funds Management Limited (ABN 15 159 557 721, AFSL 426455) makes no representations or warranties as to the accuracy or completeness of any statement in it including, without limitation, any forecasts. Past performance is not a reliable indicator of future performance. This article has been prepared for the purpose of providing general information, without taking account of any particular investor’s objectives, financial situation or needs. An investor should, before making any investment decisions, consider the appropriateness of the information in this article, and seek professional advice, having regard to the investor’s objectives, financial situation and needs. This article is solely for the use of the party to whom it is provided.


